Friday, December 20, 2013

From unported to international in the 4.0 Creative Commons License

photo credit: Wikimedia Commons 
Shiny new 4.0 Creative Commons licenses were released last month and I noticed that unported had been replaced with the word international. So it made me want to investigate just what unported really meant and discover what changes come of using international in it’s stead.

According to the FAQ section of the CC Wiki, unported licenses are/were basically a general international CC license meant to be used and recognized worldwide. However, ported licenses came about when tweaks to the general license were added to clarify issues surrounding local copyright legislation in different jurisdictions. In fact, a whole jurisdiction database was created to compare the different iterations (ports) created for different locales.

So, does the new 4.0 creative license finally bring an end to ported CC licenses?  Not necessarily, though there are currently no ports of the 4.0 license (it is brand spankin' new after all) and the intention was to write it in such a way that ports would not be necessary, the CC wiki leaves the door open a crack as it goes on to say that “few, if any, will be created.” With that being said, the 4.0 license does appear to bring us that much closer to a truly worldwide common standard for open licensing. And that is a very good thing…
This latest infographic will be used in a workshop I'll proved next semester to introduce students to basic design elements for information visualization and free tools for the less tech savvy.
Based on how the class goes, I'm hoping to publish the lesson plan. So stay posted!

Tuesday, November 12, 2013

Practical Applications for Google Earth

GoogleEarthIntroduced in 2005, Google Earth is a three-dimensional virtual globe overlaid with dynamic data layers that let you explore land, oceans, moon and stars. There’s even a tour guide option that will give you historical information about significant places and events.

TrafficDataViewerGovernments and businesses are using it to make decision for location based projects by analyzing geospatial information layered by topographic, demographic, traffic data, and the like.  For example, the New York State Department of Transportation has developed a Traffic Data Viewer that uses data from the National Geodetic Survey (NGS) Database (a google earth application) to display published traffic data graphically. County administrators can use this resource to plan repaving efforts or an entrepreneur could use local traffic patterns to determine the best location to open up their new start-up.

everest-googleearthEducators are using it extensively in many different disciplines and ways, such as understanding global development, selecting and visualizing field study sites, studying land-use law and to depict the locations of many of the disputes, visualizing historical events and issues like the Trans-Atlantic slave trade routes, the underground railroad, the abolishment of slavery in Great Britain, mapping field trip routes, analyzing communication systems and so much more.

Plus, the Google Earth community is a great place to find data and can be used to explore historic grave sites, find overlays and place-marks related to Hurricane Katrina and the subsequent flooding in New Orleans, study locations of large airliner accidentsshipwrecksWorld War I & II, and more.

Wednesday, October 2, 2013

Finding statistics during the government shut-down...

closed
photo credit: flickr user Nick Papakyriazis

On October 1, 2013 The government shut down (again).

I've been working with students to two sociology classes who's assignments were to gather statistics on a country or state assigned to them. Of course, a good deal of the statistics they need to gather come from government websites like the U.S. Census Bureau and the Bureau of Economic Analysis, whose websites now post shutdown notices rather than providing access to the data usually available.

Frantic students in those classes are now looking for help finding alternative sources for the information they need.  Here are a few suggestions for students:

1. Try using government sites that appear unaffected (at least so far) by the shutdown (i.e. bjs.gov and bls.gov are both still accessible at the time of this posting).

2.  Search for state government sites that contain federal data (http://www.statelocalgov.net, http://www.globalcomputing.com/StatesContent.htm, or http://www.50states.com might be good places to start).

3. Try a Google search for the state and statistic for which you are looking (ie. GDP and California).  Look for state websites among the results.  If your professor will not allow you to use wikipedia, you may wish to see if wikipedia cites a source you CAN use.

4. Try finding an article (scholarly or news) that incorporate the statistics you seek.

Tuesday, October 1, 2013

Skilling Up for Data Curation Infographic

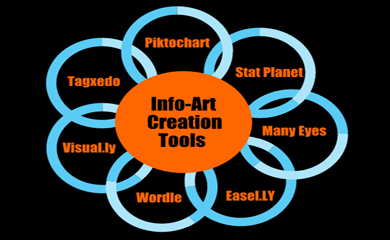
My latest infographic, Skilling Up for Data Curation, using Piktochart examines the skills and tools I'll need for data curation at my campus.  The infographic was used for a poster session on the topic for the Fall 2013 conference of the Western New York/Ontario Chapter of the Association of College Research Libraries (ACRL).

There has been a lot of discussion over the last several year about the role that libraries should play in data curation efforts at their institutions.  Technical advances have made it possible for the creation of larger and larger amounts of information/data/research/scholarship.  How best to manage and preserve this influx is under debate, especially given the challenges; the sheer volume, different media types, intellectual property issues, obsolescence of formats/software and lack of metadata to name a few...

[caption id="attachment_190" align="aligncenter" width="300"]DataCurationLifecycle-DCC 
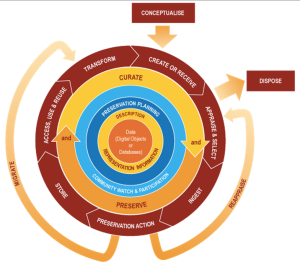
DCC Curation Lifecycle Model[/caption]

What we do know is that data curation must be a collaborative effort between librarians and data creators  for two important reasons: to have the metadata necessary for curation later in the data lifecycle and to education data creators about the need for standardization of metadata.  Consistent standards used by researchers within a discipline, or better yet across disciplines, will allow for the opportunity to automate some (perhaps all) of the curation process and the possibility for adding smaller datasets to the corpus of curated data outside our own small institution for reuse by others, attaining an even greater return on investment.

Digital curation is far removed from the the institutional repository of the past.  Reappraisal and providing access in ways (and formats) that the data can be readily reused is key so that our digital collection don't wind up looking like an old attic where we've abandoned our institutional data.

Through a series of discussions with faculty on our campus this summer, we found that, as yet, there is no great demand for data curation with respect to faculty research.  However, we have begun developing skill sets in this area so we'll be prepared with technology and infrastructure options in anticipation of future needs.

During these discussions, we found several areas where the library immediately could serve:

  • Provide assistance locating discipline specific repositories for finding and publishing research data.

  • Provide instruction or workshops for undergraduate students to improve skills in managing both laboratory and their own data.

  • Provide assistance in developing data management plans on funding applications.

  • Identify faculty work or research projects that could/should be digitally curated.


Education and ongoing discussion with faculty about developing standards for metadata and opportunities and benefits for open data sharing will be key.  We also have the opportunity to to be selective about the projects we pursue and to pace our digital initiatives in ways that are practicable in terms of resources, time and funding.

References:
Bird, C., Willoughby, C., Coles, S., and Frey, J. (2013). Data curation: Issues in the chemical sciences. Information Standards Quarterly, 25(3): 7-12.

Digital Curation Centre. (n.d.). Data curation lifecycle model.

DataCite: Helping you find access, and reuse data. (n.d.). Why cite data?

Lee, C. A., Tibbo, H., & Schaefer, J. C. (2007a). DigCCurr: Building an international digital curation curriculum & the Carolina Digital Curation Fellowship Program.

Schirrwagen, Jochen, Paolo Manghi, Natalia Manola, Lukasz Bolikowski, Najla Rettberg, Birgit Schmidt. (2013). Data Curation in the OpenAIRE scholarly communication infrastructure. Information Standards Quarterly, 25(3): 13-19.

Smith, K. (2009). All universities should have an institutional repository. Bulletin of the American Society for Information Science and Technology (Online), 35(4), 11-31.

Wednesday, June 19, 2013

Feedly Transition...

transition
For those of you who have made the switch from Google Reader to Feedly…

I just read on their blog that Feedly is in the process of migrating G reader content. In order for this to work right, they're recommending that you update your browsers to version 16.

  • Chrome: Open your chrome extensions (from the toolbar select Window then Extensions) and make sure you're using version 16.0.514. If not, click on "update."

  • Firefox & Safari: go to Feedly and install the app (remember to restart your browser too!)

  • iOS: go to your app store and update for version 16.0.1 then restart the app.

  • Android: go to your app store and update for version 16.0.5 then restart the app.(If unsure what version you have, you can always uninstall/reinstall)


For more info, check out the Feedly Blog.

Happy reading folks!    :)

Friday, May 24, 2013

Tornado Track Infographic

This infographic shows tornado paths for all tornados 1950-2011 for an amazing visualization of tornado alley.
Tornado Tracks


The roles of data in publishing and scholarship; musing on research attribution

purpleDataImgA few weeks ago, I had the opportunity to listen in on portions of the ORCID/Dryad symposium on research attribution being held in Oxford. Something that really stood out for me was David Deroure's description of the future of scholarship as "an ecosystem of interacting scholarly social machines" where the case can be made that social tech like Twitter becomes an "infrastructure and every hash tag is a social machine" for scholarship. What an exciting time to be involved in developing/contributing to this new ecosystem.

When it comes to data citation/altmetric tracking and attribution, there are so many things that still have to be hashed out. Christine Borgman, who serves on the CODATA-ICSTI task group on data citation standards and practices, pointed out that we already have a broken model for citation metrics just for article publication, let alone coming up with standards that include data, software and other less traditional forms of scholarly output. She posed so many questions that quickly need to have answers, including how the many contributors involved in data often want attribution, but which of those roles deserve it and the responsibility/accountability that comes with it (either social or legal)? Publication of these nontraditional outputs will help with both attribution and accountability, but will also create a whole new set of problems, questions, and needs for standardization.  It'll also be interesting to see where the library/librarian's role in assisting with the curation of data falls with regard to questions of attribution...

Why we cite will also drive the shape of this evolving model, particularly decisions about whether more emphasis will be placed on creating mechanisms for linking, discovery of and REUSE (including the transformation of data as it is reused) of these outputs than on the idea of simply giving credit.  I'm hoping it's more the former than the latter, though I completely understand the importance and need for attribution.

This summer, I and some of my colleagues on campus are dedicating a bit of time to explore this ecosystem and the future that SUNY Geneseo might have in it.  I have no doubt that it will be an interesting process.

Thursday, May 9, 2013

2012 Voting rates from the Census

It's been a long haul for the African American civil rights movement, and I know it's far from over… But I was pleased to see that, for the first since the Census Bureau began reporting voting rates, blacks voted at a higher rate in the 2012 election than whites. For more detail, check out the U.S. Census Bureau's analysis of the Current Population Survey.

2012 Voting Rates

Tuesday, May 7, 2013

And hopes of open access recede farther into the darkness

grumpycloudI just got some discouraging news about Harvard Business Review this week and have been struggling with how to share it with the faculty on campus (HBR is available in our subscription of EBSCOhosts' Business Source Complete).

But let me back up and start from the beginning...  Harvard Business Publishing has decided to add another level of purchasing permissions in addition to what we pay for the database for their most popular 500 articles and case studies from HBR.

These articles (which evidently will change every year based on popularity/demand) can still be found by searching for them in the database using the citation or through a topical searches, but as of August 1, 2013 can only be viewed as read-only material, which means they cannot be printed, downloaded, shared, linked to, or used in the classroom in any way!  Just in case you think I'm exaggerating, here is the complete notice of restriction for usage:


“Harvard Business Review Notice of Use Restrictions, Harvard Business Review and Harvard Business Publishing Newsletter content on EBSCOhost is licensed for the private individual use of authorized EBSCOhost users. It is not intended for use as assigned course material in academic institutions nor as corporate learning or training materials in businesses. Academic licensees may not use this content in electronic reserves, electronic course packs, persistent linking from syllabi or by any other means of incorporating the content into course resources. Business licensees may not host this content on learning management systems or use persistent linking or other means to incorporate the content into learning management systems. Harvard Business Publishing will be pleased to grant permission to make this content available through such means. For rates and permission, contact permissions@harvardbusiness.org.”


 I know trying for tact is the best modus operandi.  Though I'd really just like to offer my help finding alternative articles and case studies, so our entire campus can thumb its metaphorical nose at Harvard Business Publishing.  Melodramatic, but tis how I feel.

Now that I've had my rant, my first step will be to gauge impact from HBR usage and then compose a tactful, yet informative email to faculty.  <sigh>


Monday, May 6, 2013

Ousting wiki from Wikipedia...

Wikipedia-WTFI just read a disturbing article in the Economist about Wikipedia that makes me wonder just how much the content is really "crowd sourced."  Essentially, the administrators of said site were quietly changing the categories (and then later the entry of the author who brought the changes to light by removing the link to her New York Times article which pointed out the changes they were making) so that all American female authors were shifted into a separate sub-category called American Women Authors, leaving only male authors in the American Authors category. Evidently, it's stirred up quite the controversy at Wikipedia.

Wednesday, May 1, 2013

One of my most useful teaching assets...

So, I'm taking an inventory of what digital assets I use in library instruction sessions. One that I use quite often is a hierarchy of journals for teaching about the levels of scholarliness articles found in our databases can have:

hierarchyOfJournals

Monday, April 22, 2013

Earth Day fail...

ecofootprint
So I took the footprint calculator quiz and discovered much to my dismay that I'm an ecological hog. If everyone lived like me, we'd need 5.2 planet earths to provide enough resources. Just to support me, it takes 23 global acres of the earth's productive area.

How does the US rate as a whole?  Sadly, the gap between our ecological footprint and the planet's biocapacity to sustain us has only widened in the past two years.

The planet's not going to multiply, so how can I better fit the planet?   To decrease my footprint I'll:

  • purchase products that use less packaging and those I do purchase will be made out of post-consumer recycled materials

  • take less vacations involving air travel. I'll continue to carpool and purchase vehicles with better fuel economy.

  • buy locally produced food (less packaging, trasport costs and the like mean a smaller footprint)

  • plant a  fruit/vegetable garden and compost organic materials (zero packaging or transport costs).

  • plan the week's meals in advance to cut down on food waste, trips to the market and impulse buying

  • buy second-hand items, especially for the kids who grow out of things so quickly (recycling that's good for the earth and for the pocket-book)

  • lower my thermostat by 4 degrees (and program it to stay low)

  • continue to recycle (here's a list of recyclables from the EPA)

  • continue to use the green option from my public utilities provider


Here are even more ideas for living green.

Sunday, March 24, 2013

Business assistance for local entrepreneurs

OpenBusThe Small Business Administration and Department of Labor have partnered on a new website to help states offer assistance to local entrepreneurs who want to start their own businesses.

The site is geared toward helping states take advantage of the $35 Million the federal government gave to states to implement Self-Employment Assistance programs to help those looking to create jobs in their communities.

These programs provide Unemployment Insurance recipients interested in starting a business with financial assistance, training and resources to get their businesses off the ground. Among the links to resources on the site, there is a link to the New York State fact sheet on how to apply for local assistance through this program.

Thursday, March 21, 2013

Biz infographic of the week

Check out this great infographic of the ten most successful entrepreneurs under age 30.

Top 10 Entrepreneurs Under 30
Source: The 10 Biggest Entrepreneurs Under 30


Wednesday, March 20, 2013

Count down to earth day

This year, earthday.org is focusing their theme on facing climate change.  To draw attention to the fact that climate change impacts us all, a global mosaic is being built.  Organizers are asking folks to upload photos that include a face with a sign that says "The Face of Climate Change."  So go ahead and personalize your message to the world.

earthday


Tuesday, March 19, 2013

March madness bracketology: Census style!

Ready to get your Geek on?  The US Census Bureau has a new game where you can choose your brackets based on population tables.  Who knew Texas was bigger than New York?!

Screen Shot 2013-03-19 at 3.58.13 PM

Infographics get a second wind

Info-ArtToolsInfographics have been around for centuries, from ancient cave paintings  to modern subway maps to (probably the most recognizable infograph of all time) the Periodic Table published back in 1869.

Recently, infographics and info-art have gotten a second wind.  Data visualization has have become a popular trend for folks who want to quickly and easily present complex information.  It's no wonder since we live in an age where data is being produced at exponential rates.  In fact, Google executives estimate that every two days, we create as much data as we did between the "dawn of time through 2003."  Every two days!  Much of this is generated from social media such as Facebook, Twitter, Four Square and the like.

The increasing number of easy-to-use tools available has also made it easier for those without a degree in design to generate creative infographics; and to share them with the masses via social media.

Here's a few tools that you might try:


Piktochartvisual.lyTagxedo
Wordleeasel.lyMany Eyes
 Stat Planet by Stat Silk infogr.am creately

....more tools.